Fig. 3 a
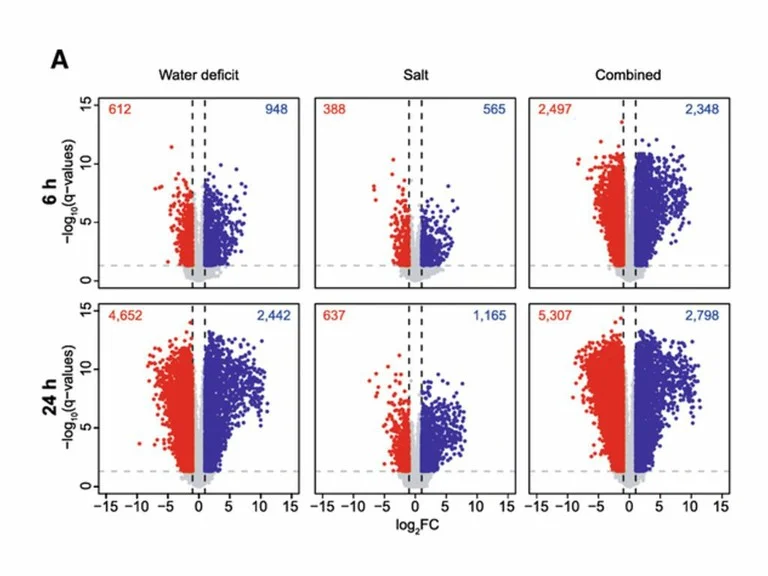
Overview of differentially expressed genes (DEGs) between control and stress-treated samples. a Volcano plots depict DEGs for each treatment-by-time combination. Up-regulated DEGs are indicated by blue dots, down-regulated DEGs are indicated by red dots. Total number of DEGs are shown in the upper left and right corner for significant up- and down-regulated DEGs. DEGs that do not exceed the threshold of |log2FC| >1 and FDR ≤1% are depicted in grey.
